ResearchPrepared: January 2026

2025 Multi-Asset Allocation Research: Returns, Correlations and Diversification

Key findings

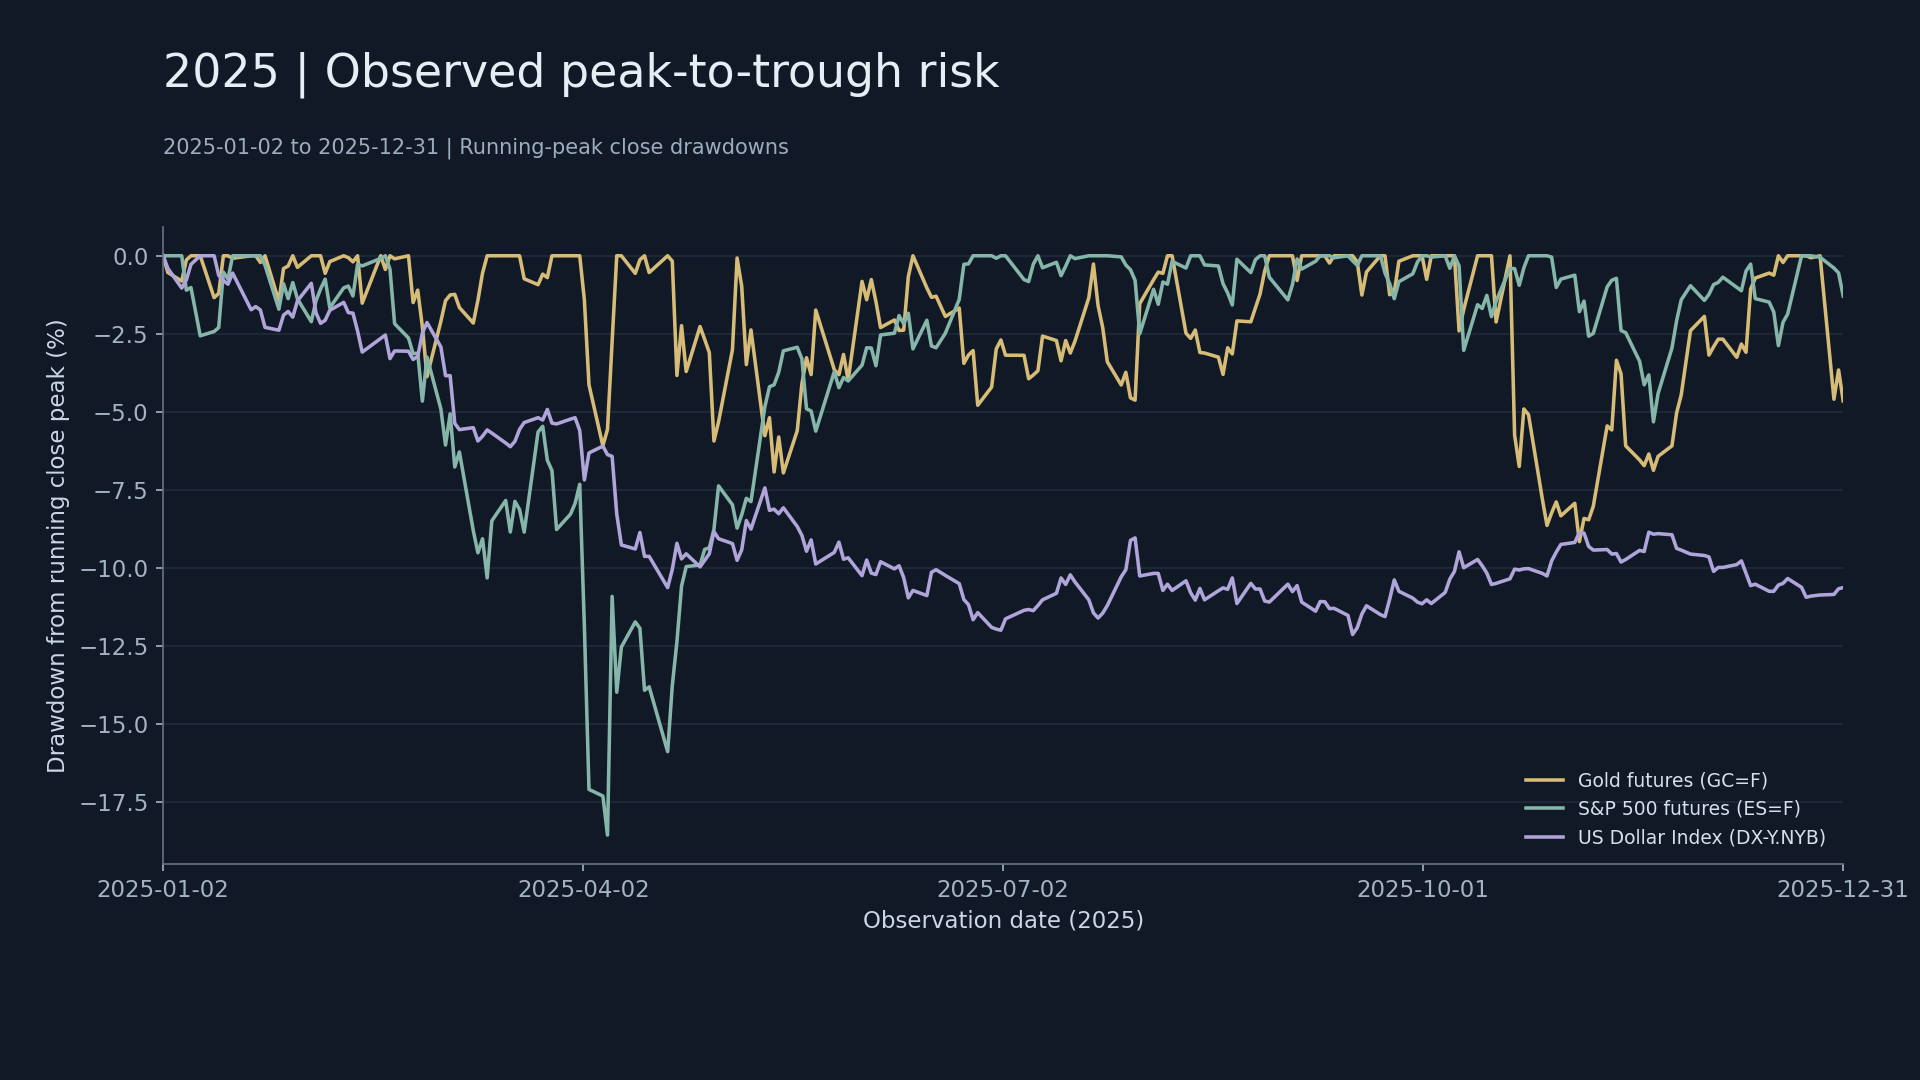
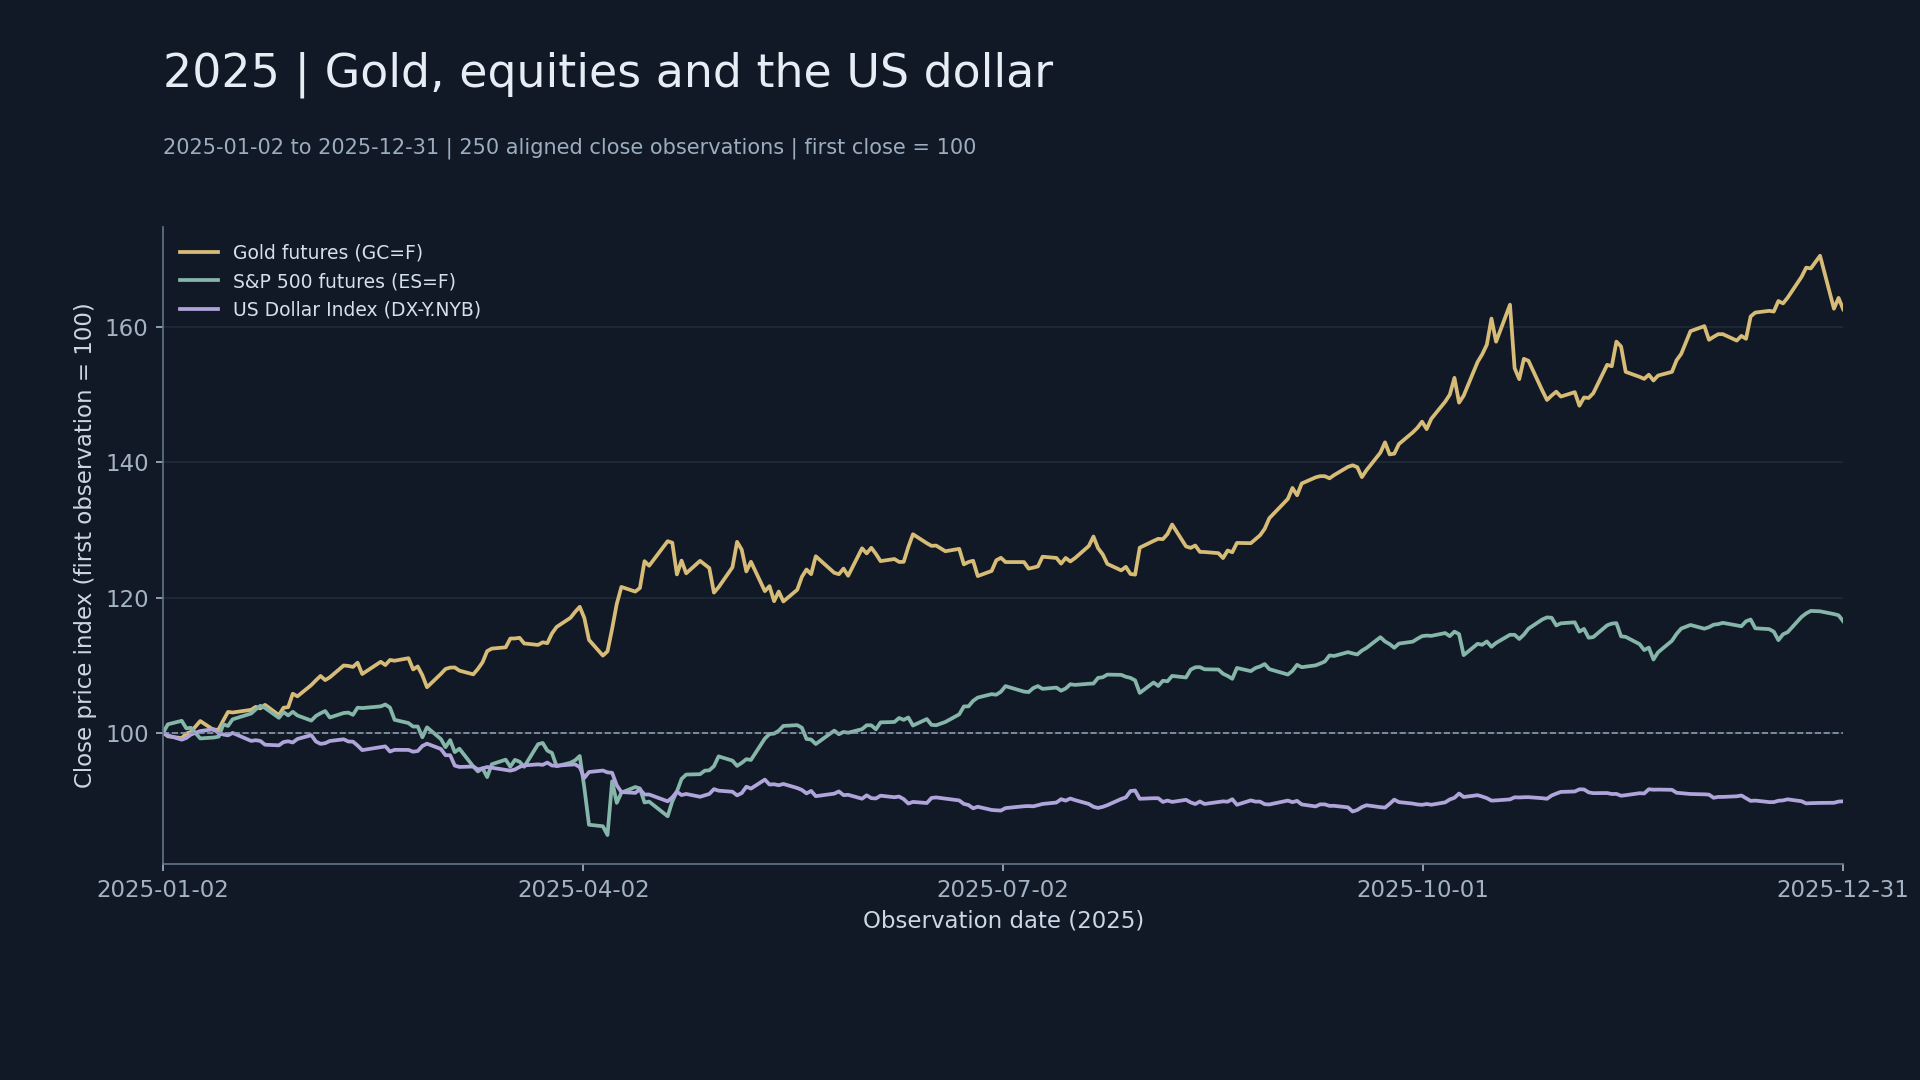
This study tests whether assets provide complementary risk exposures, rather than simply ranking their full-year gains. In the common 2025 sample, gold futures had the largest price increase, while equity index futures had the deeper maximum closing-price drawdown. Allocation analysis must consider returns, volatility, drawdowns and joint behavior under stress; the best-performing asset is not automatically the optimal portfolio.

Observation period

The four series are aligned on comparable trading days from 2025-01-02 to 2025-12-31, retaining 250 observations. Gold and equities use futures series GC=F and ES=F, while the dollar uses DX-Y.NYB. ^TNX is the Cboe 10-year U.S. Treasury yield indicator, quoted in percent. Open the interactive market comparison · Download data

Results

MarketPrice change over the periodAnnualized sample volatilityMaximum closing-price drawdown
Gold Futures+62.65%20.99%-9.15%
S&P 500 Futures+16.50%19.08%-18.54%
U.S. Dollar Index-10.16%7.44%-12.12%
Gold and equity index futures rose over the observation period, while the U.S. dollar index fell. ^TNX moved from 4.575% to 4.163%, a change of -41.2 bp. A change in yield levels is not a bond investment return.

Calculation conventions

Price series are rebased to 100 at the first comparable trading day’s close. Return = final close / initial close − 1; annualized volatility is the sample standard deviation of simple returns multiplied by √252; drawdown measures the change from the prior closing peak. Full-period price changes exclude the move from the previous year-end to the first observation, as well as cash flows, roll returns and costs.

Research question and comparison scope

Gold futures, S&P 500 futures and the U.S. dollar index are compared as price series. The 10-year yield is considered separately as interest rate context. Prices are measured as percentage changes, while yields are measured in percentage points and bp. Rebasing to 100 aligns chart starting points, not risk exposures, and does not imply equal portfolio weights. This report does not have cash returns, continuous futures roll transactions, financing data or portfolio weights. It therefore cannot calculate an implementable strategy’s NAV or Sharpe ratio. The findings support research hypotheses and a risk checklist; they do not replace a backtest of an implementable portfolio.

Full-sample and short-window correlations

Correlations use closing-price returns between adjacent comparable trading days, not price levels, which may be misleading because of shared trends. The full-year sample has 249 return observations; the short window at the end of the observation period has 20.
Asset pairFull-sample Pearson rLast 20 observations: Pearson r
Gold Futures/USD Index-0.410-0.208
Gold Futures / S&P 500 Futures0.0210.296
U.S. Dollar Index / S&P 500 Futures0.128-0.508
Gold’s correlation with equity index futures is 0.021 over the full sample and 0.296 over the last 20 observations. The dollar’s correlation with equity index futures changes from 0.128 over the full sample to -0.508 in the short window. Sample selection affects diversification judgments; a relationship observed over roughly the last month cannot be extrapolated as stable over the long term. A correlation near zero indicates only a weak linear relationship, not independence in extreme scenarios. A negative correlation does not guarantee protection on every down day.

Equity stress days: did other assets provide protection?

The table selects the five worst adjacent-trading-day returns for equity index futures in this sample and compares the other assets on those dates. The selection rule is fixed before examining the other assets, avoiding a selection of dates that only supports a “safe haven” narrative.
DateEquity index futures returnGold futures returnU.S. dollar index return
2025-04-04-5.94%-2.76%+0.93%
2025-04-03-4.89%-1.41%-1.68%
2025-04-10-3.44%+3.19%-1.97%
2025-10-10-2.71%+0.70%-0.56%
2025-03-10-2.69%-0.50%+0.07%
These five observations do not cover every stress scenario and cannot estimate the probability of catastrophic losses. They test a narrower point: full-year performance and protection under stress are different questions. An allocation proposal would require further examination of sustained stress windows, rolling correlations and funding needs, rather than reliance on a full-year price chart alone.

From market observations to allocation

Specify the base currency, investable instruments, risk budget and rebalancing frequency, then use actual tradable returns to estimate covariance and risk contributions. A low-weight but volatile asset may still dominate portfolio risk; similar notional amounts do not imply similar risk contributions. This study does not propose “optimal weights” without investment constraints. If portfolio data becomes available, fixed-weight and risk-budget approaches can be compared under the same transaction costs, cash returns and observation period, assessing drawdown, turnover and risk contributions. Holdout or rolling samples are needed to reduce dependence on a single year’s market conditions.

Conclusions and limitations

The three 2025 series have different return and drawdown paths, warranting further study of diversification. However, multiple assets alone do not constitute risk control: common liquidity shocks, leverage and margin calls can make different assets demand cash simultaneously. Research must extend to positions and cash flows rather than stop at a correlation table. View the price comparison chart · Compare the drawdown analysis Download aligned-date data. Futures price series may be affected by contract rolls. Price changes are not investment returns inclusive of rolls, cash flows and costs. Prepared: January 2026. Download the research calculation summary.

Related research

2025 Treasury Term Spread: Changes and Analytical Limits

2025 Treasury Term Spread: Changes and Analytical Limits

Decompose short- and long-end contributions to the yield spread, examine curve steepening and distinguish portfolio risk from bank net interest margin.
2025 Observed Drawdowns and Dollar Risk Scenarios

2025 Observed Drawdowns and Dollar Risk Scenarios

Identify observed peaks, troughs and recovery dates; examine recovery requirements and distinguish notional exposure, account equity and scenario P&L.
2025 U.S. Treasury Yields: Short-End and Long-End Changes

2025 U.S. Treasury Yields: Short-End and Long-End Changes

Compare short- and long-end yields by quarter, distinguishing yield direction, curve shifts and their effects on cash-flow valuation.